Jesse M.
Heines, Ed.D.
Associate Professor
Department of
Computer Science
University of Massachusetts Lowell
Lowell, MA 01854
Phone: 978-934-3634
FAX: 978-934-2551
E-mail: heines@cs.uml.edu
Web: http://www.cs.uml.edu/~heines
this paper was published in the
Journal of Computing in Higher Education
Volume 12, Number 1, pages 57-83
October 2000
A number of course Web sites were created to enhance traditional classroom instruction in courses for computer science majors. These Web sites contained a large number of features including all course lecture notes and assignments and a CGI program that allowed students to see their grades and determine exactly where they stood in the class at any time.
Students were surveyed to determine their attitudes toward the use of the course Web site and which features they found most valuable. Students demonstrated strongly positive reactions and identified the on-line lecture notes as the most valuable Web site component.
Statistical analyses were performed on final-grade data for one course that a single professor had taught both with and without a course Web site and for which he had historical final-grade data from both periods. These analyses revealed statistically significant differences between student grades before and after the Web site was introduced. While these results should be interpreted conservatively due to the large number of variables that might have affected student performance but were impossible to control, they are nonetheless encouraging and warrant continued effort to develop course Web sites.
The creation of an effective course Web site is a great deal of work. Various tools exist to help educators “put their courses on the Web,” from specific tools for education such as Web Course in a Box (MadDuck Technologies) to Web page publishing wizards for existing materials in, for example, Microsoft PowerPoint (Microsoft Corporation) to general WYSIWYG Web page editors such as Microsoft FrontPage (Microsoft Corporation). Regardless of the tools used, an educator who creates a Web site and makes it an integral part of his or her course soon discovers that designing and producing the initial Web site are only small parts of the entire task. Maintaining that Web site throughout an entire semester -- keeping its content current and its links up-to-date -- is a much more time-consuming activity, by far.
David Jordan (1997, [5]) attempted to “create a class Web site that would have a measurable effect on the students’ education and/or morale” in a course entitled Making of the Modern World. Based on student responses to an instructor-designed survey and examination results in six semesters in which the course was offered (only the last of which used a course Web site), Jordan concluded that “the course seems to be better, but it is not knowable quite how much better, and the difference probably is not much.” Given his finding that “creating and maintaining the site roughly doubles the work involved in teaching the course,” Jordan was clearly disappointed that this effort did not have any “demonstrable educational effect.”
There appears to be widespread agreement that the creation of a course Web site is a significant undertaking. But then again, all efforts to improve education, particularly those related to the integration of technology, have historically required huge time and energy commitments on the part of a small number of dedicated faculty.
Steve Gilbert, President of the Teaching, Learning, and Technology Affiliate of the American Association for Higher Education, observes that many faculty, administrators, professional support staff, and students, though excited about new ideas and new uses of technology to improve teaching and learning, are also “frustrated and worn out with the amount of time and effort it takes to use technology responsibly and effectively” (Gilbert, 1998, [4]). While some critics conclude from this observation that students and faculty are lazy, Gilbert believes that the integration of technology is “impeded more by the lack of truly reliable, adaptable technology applications and instructional materials than by faculty and student resistance.” He concludes that “the astonishing observation is that so many people are willing and able to make the extra effort to try new approaches, modify them, and integrate the ones that really work.”
As one might imagine, Gilbert’s posting generated a large number of responses on the amount of effort needed to integrate technology into education and how that effort precludes any semblance of laziness. Some of the most substantive came from Candyce Williams Glaser (1998, [13]), who reported that she found no evidence of students and faculty being lazy in her doctoral study of professors’ use of technology at the Peabody College of Vanderbilt University.
Rather than demonstrating laziness, Williams Glaser observed that “faculty members who are willing to re-analyze their pedagogy and to consider ways in which technology can enhance their instructional practices end up putting many more hours into their course preparation time.” She noted that “these instructors enjoy varying degrees of success depending on a variety of factors; however, for most the decision to continue to teach with technology is based on their analysis of the effects that it has on student learning.” Survey response data indicated that students would like to see more technology in their classes, but only if it is used in meaningful ways. Both faculty and students indicated that “they do not have the time or the desire to use any technology unless it results in a greater understanding of the course content.”
Determining whether the use of technology “results in a greater understanding of the course content” as Williams Glaser puts it, is also a great deal of work. William Trochim (1996, [12]) and his students have investigated “a variety of methods for evaluating Web site development and use and the effects of the World Wide Web on the people who use it.” Their findings, however, are less than conclusive.
Working with Trochim, George Fitzelle (1996, [3]) used a student survey to try to determine “whether the Web site enhanced student perceptions of learning” [emphasis added -- JMH] by asking three Likert-scale questions:
Using a scale of 1 for Strongly Agree, 2 for Agree, 3 for Disagree, etc., the mean responses to these questions were 1.97, 1.87, and 1.88, respectively. Fitzelle and Trochim reported that these results indicate “students thought that the Web site significantly enhanced their learning of course content” [emphasis added -- JMH]. The important caveats in this statement are
Thus, while Fitzelle and Trochim’s survey approach may accurately measure students’ perceptions of their own learning, one cannot attach statistical significance to the results in terms of the Web site’s effect on actual student performance. It is important to reiterate that Fitzelle and Trochim do not claim to have measured statistical significance. Rather, the fact that they did not attempt to do so may be an indication of the difficulty of doing so.
The task of evaluating whether the technology improves learning is so difficult, in fact, that some have taken a markedly pessimistic view toward the value of such research and the types of questions that it can answer. For example, in commenting on questions such as
Stephen Ehrmann (1995, [2]), who must certainly have seen his share of educational research as a program officer for the Fund for the Improvement of Postsecondary Education (FIPSE), has stated, “I don’t think [those questions] can be answered in any reliable, valid way” [emphasis in original -- JMH].
Others are more optimistic. In a widely quoted analysis of numerous studies on the effectiveness of computer-based instruction, Kulik and Kulik (1991, [6]) found that this technology yields, on average, a 20% improvement in learning outcomes and speed. Even the more pessimistic Ehrmann believes that while the large global questions may never be answered, much is to be gained from evaluating (Ehrman, op cit, p. 27)
This is the more localized view taken in this study. UMass Lowell Computer Science offers a four-year B.S. program in which approximately 85% of the students are commuters. Most of the students also work at least 15 hours per week, and some as many as 30. About half of those students who work are employed in computing-related jobs.
The Web site evaluated for this research may be found at http://www.cs.uml.edu/~heines. The specific course Web site on which this research focuses is 91.353 GUI Programming I and its course-specific URL is http://www.cs.uml.edu/~heines/91.353. The site is completely public, so readers are welcome to visit it. The discussion and figures in the remainder of this section attempt to give a feel for the site and its contents by reviewing a few sample pages.
Note: The figures in the on-line version of this paper are presented as thumbnails to decrease download time. Click on the figures to display a full-scale images.
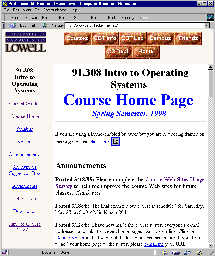
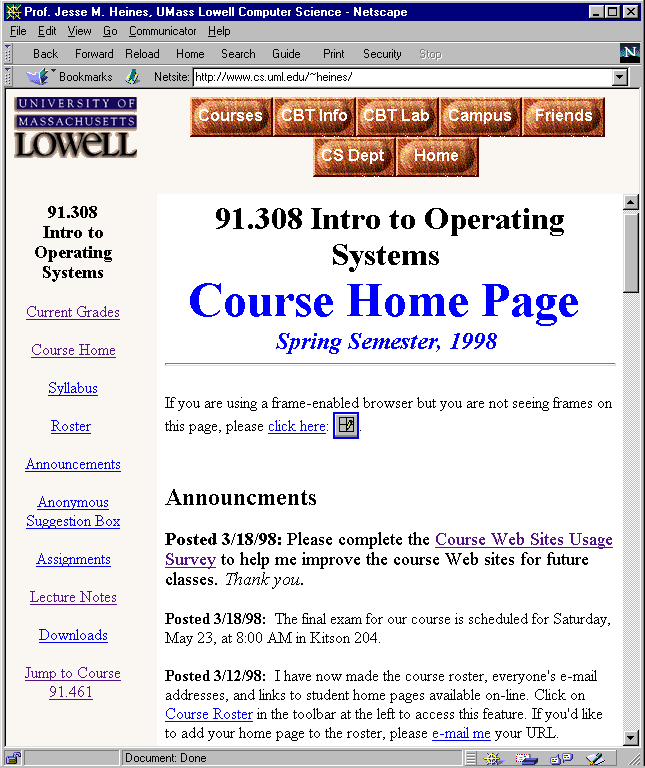
The Course Home PageThe course home page is shown in Figure 1 at the right. If students browse to this page using the course-specific URL, they see only the main frame, but the first line tells students to click on a button if they are using a frame-enabled browser to see the frame view shown in Figure 1. The main frame of this page begins with course-specific announcements. Further down the page students find a list of all course assignments with links to their individual write-ups, a list of all lectures (see Figure 2) with links to detailed lecture notes for each class, and links to files they can download containing code discussed in class, code to be used for assignments, and links to useful utilities such as WinZip. All of these features, including others, are accessible from anywhere in the course Web site using the table of contents in the frame at the left. The keywords in that frame link to
The buttons in the frame at the top provide access to
home pages for the professor’s other courses as well as
research-related areas of his Web site, the main UMass
Lowell home page, and that of the Department of Computer
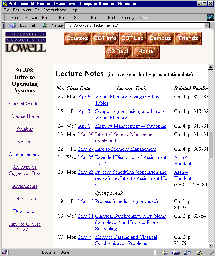
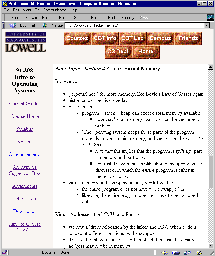
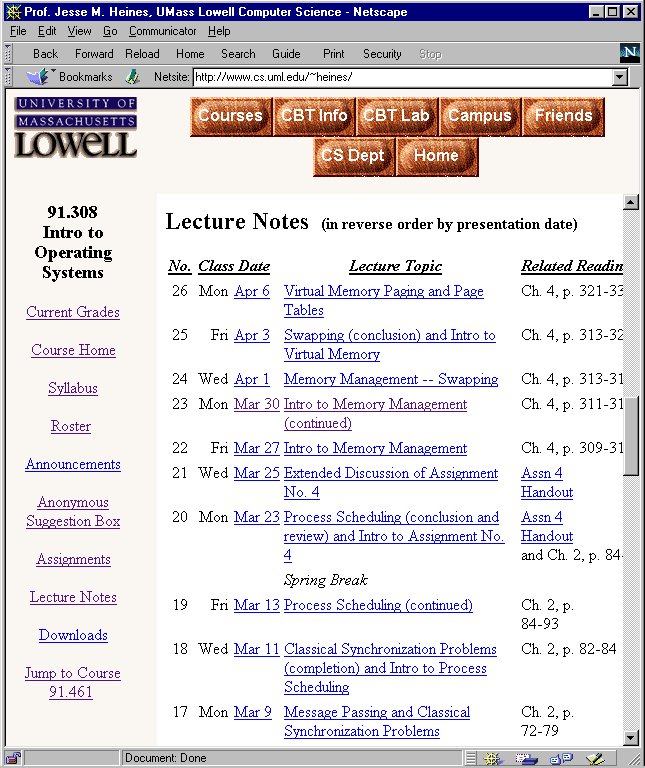
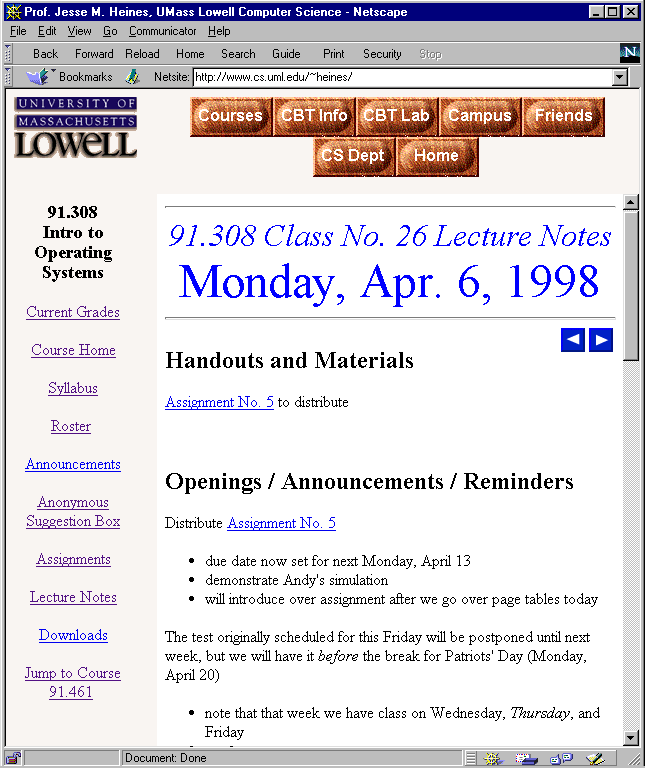
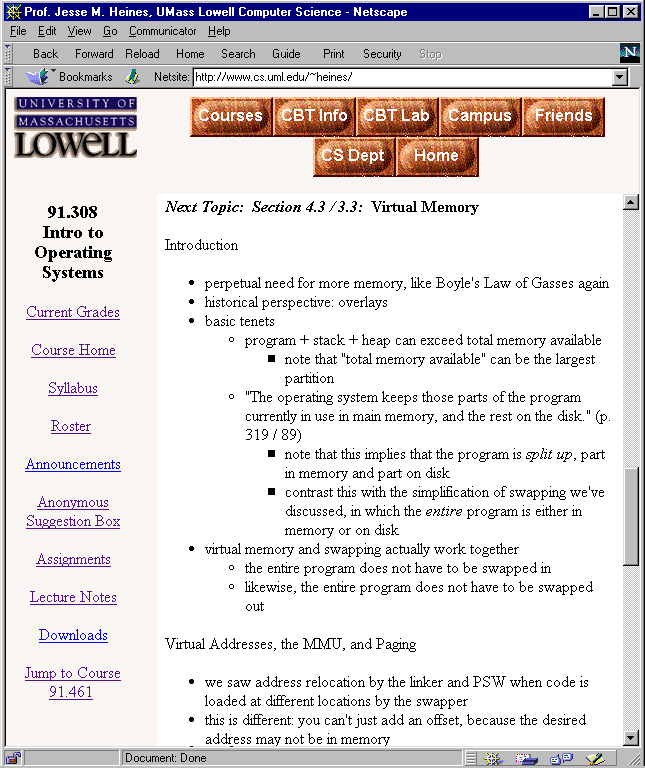
Science. Lecture NotesStudents indicated in a survey (discussed later in this paper) that the availability of detailed lecture notes for each class was the most valuable aspect of the course Web site. Figures 3 and 4 show the detail provided in these notes for a typical lecture. The maintenance of lecture notes proved to be a significant time for the professor. Notes were typically posted the day before each lecture, and students often came to class with a printout of the notes. Some claimed that this helped them better follow the lecture and others said that having their own copy made it easier to take notes right on the same sheet. After the lecture, the professor updated the previous
lecture’s notes as he prepared the next lecture’s notes
to accurately reflect the exact material covered.
This was seldom the same as what was originally planned
and laid out in the notes due to shifts in response to
student questions and other unforeseen factors. The
notes then became a sort of journal of the dynamic flow
of the course, and students reported that they found the
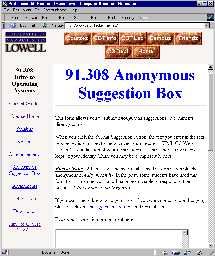
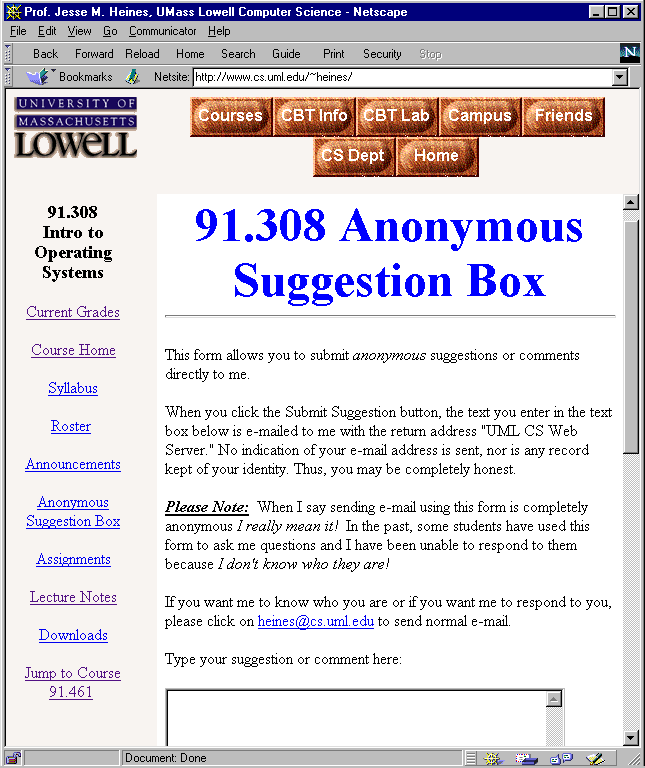
revised on-line notes valuable in preparing for exams. Anonymous Suggestion BoxWhen the course Web site first “went public” in fall 1996, students didn’t “hit” it as often as expected. The site had less functionality at that time, but it contained the same basic content -- lecture notes and assignments -- as it does today. The professor therefore tried to think of “carrots” that he could add to the site to encourage students to hit it. His first idea was an Anonymous Suggestion Box (see Figure 5) that allowed students to comment on the course without identifying themselves. This feature was not heavily used. The professor
received no more than a half dozen anonymous e-mail
messages in any one semester. Perhaps students
didn’t feel that they needed to comment anonymously, but
more likely that their main reason for sending e-mail was
usually to get assistance, and the professor was unable
to respond to them if they sent anonymous e-mail.
Indeed, the professor received and replied to more than
400 personal e-mail messages from students over the
course of the spring 1998 semester, and the Anonymous
Suggestion Box ranked number 7 out of 8 on the survey in
students’ rankings of the value of various Web site
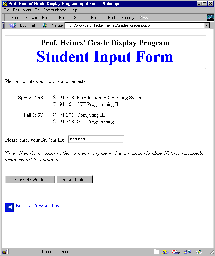
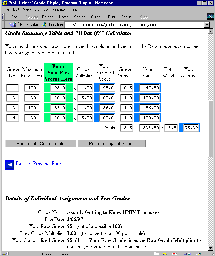
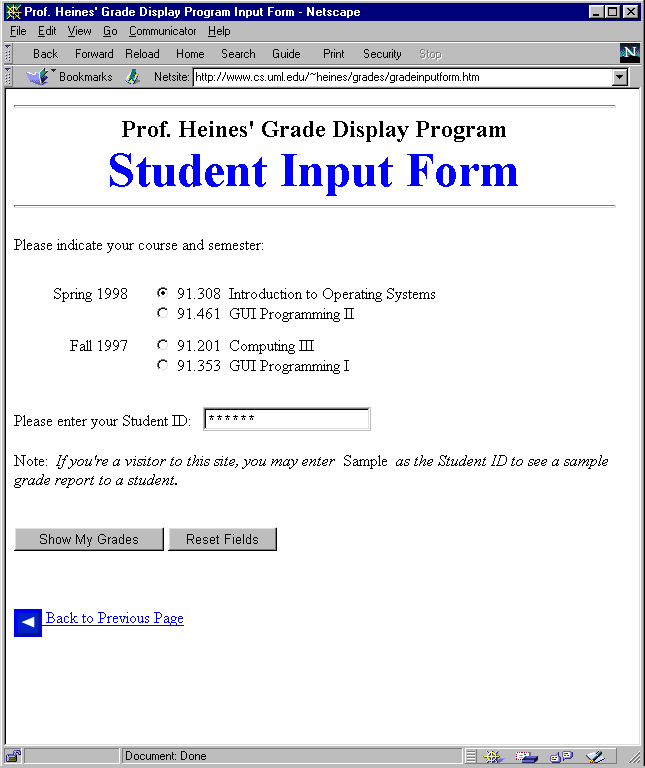
components. Grade Display ProgramThe professor’s second “carrot” idea was to create a CGI program that allowed students to view their grades on all course assignments and exams so that they would know exactly where they stood in the course at all times. This feature turned out to be extremely popular with students, and they ranked its value as number 2 out of 8 on the survey, surpassed only by the lecture notes. Describing the complete functionality of the Grade Display Program and how it was implemented is beyond the scope of this paper, but one can get a feel for its capabilities from the figures at the right. Figure 6 shows the Student Input Form that students completed to gain access to their grades. Students entered their university ID numbers (which in most cases were the same as their social security numbers), indicated the course in which they were enrolled, and clicked the “Show My Grades” button. Student ID numbers certainly didn’t provide much security, but no students indicated that this caused any concern about other students seeing their grades.
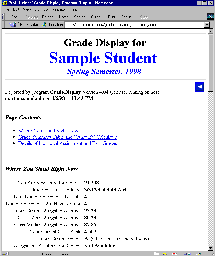
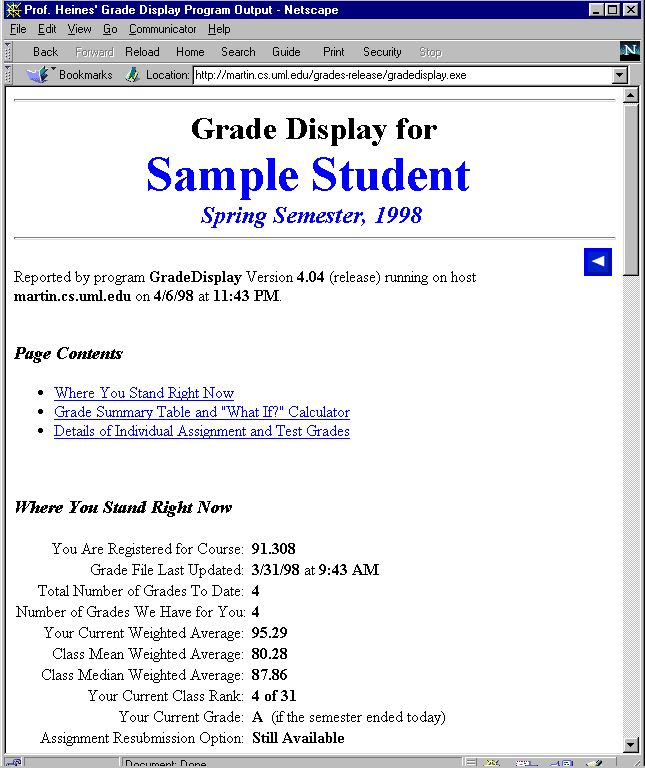
Figure 7 shows the first part of the grade display for a sample student. These data show exactly where a student stands by displaying
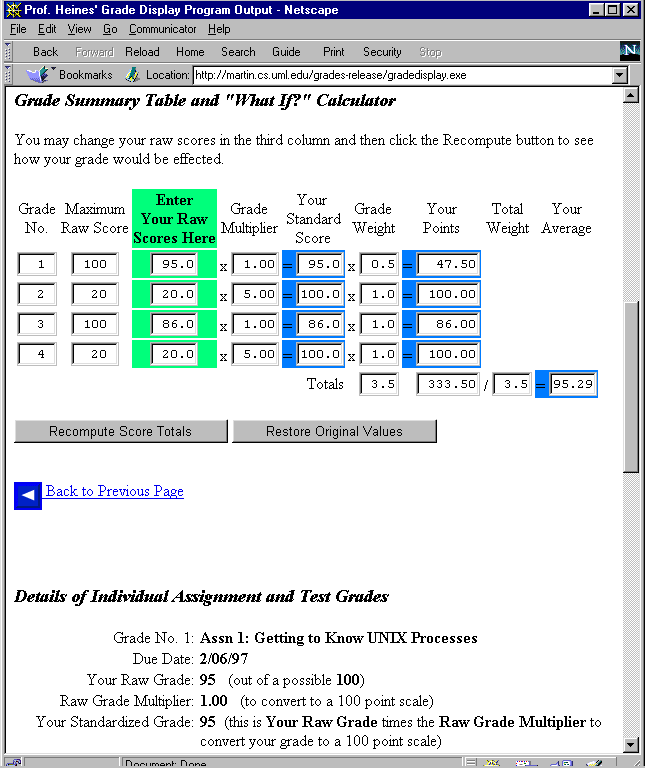
These data were read from the actual Excel spreadsheet that the professor used to store student records, so the report that students saw was always 100% up-to-date. The CGI program ran on a system running the Microsoft Personal Web Server, so the spreadsheet could not be accessed directly by students. Figure 8 shows two other sections of the Grade Display Program output, the “What If?” Grade Calculator and the Details of Individual Assignment and Test Grades. The former is a JavaScript program that clearly showed students the effect of missed homework assignments that were scored as 0. The calculator also allowed students to determine how their grade would be effected if they submitted a missed assignment late or resubmitted an assignment to improve its grade. The Details of Individual Assignment and Test Grades section provided all of the data stored for each grade awarded in the course so that they know exactly how their grades were computed. |
 Figure
1
Figure 2
Figure 3
Figure 4
Figure 5
Figure 6
Figure 7
Figure 8
|
Evaluation of the course Web site began with the student survey shown in the Appendix. The survey was made available on-line, and, while its completion was voluntary, 62 of the 84 students enrolled in the two courses taught by the professor during the 1997 fall semester did respond.
The first section used Likert scale questions to learn about
students’ attitudes toward the Web site. The texts of these
questions (numbers 4-12 in the survey) are shown below, and a
tabulation of student responses is shown in Table 1. These
data are represented graphically in the box-and-whisker quartile
chart in Figure 9. (The
quartile chart shows the 25th, 50th (median), and 75th
percentiles.)
Table 1. Student Responses to Likert Scale Survey Questions 4-12
Item |
Strongly |
Disagree |
No |
Agree |
Strongly |
Blank |
|---|---|---|---|---|---|---|
1 |
2 |
4 |
30 |
25 |
0 |
|
0 |
1 |
0 |
10 |
51 |
0 |
|
20 |
21 |
20 |
1 |
0 |
0 |
|
2 |
27 |
5 |
25 |
3 |
0 |
|
40 |
18 |
3 |
1 |
0 |
0 |
|
1 |
14 |
23 |
15 |
9 |
0 |
|
2 |
7 |
22 |
22 |
9 |
0 |
|
0 |
5 |
24 |
18 |
13 |
0 |
|
0 |
0 |
15 |
13 |
33 |
0 |
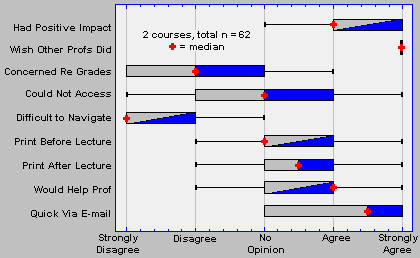
Figure 9. Likert Scale Survey Responses. Note: Readers viewing this paper via a Web browser may click on the figure to display a larger image.
This chart is interpreted as follows.
Using the quartile chart, one can see that students
overwhelmingly agreed or strongly agreed with the statement, “The presence of course materials on the Web had a
significant impact on my ability to keep up with
course” (the first item represented in the
chart). Additional questions on the survey revealed that
most students (31 of 58 responding) accessed the Web site 3-5
times per week and that many (29 of 60 responding) printed out
materials from the site greater than 10 times.
The survey contained a small number of free response
items. The most interesting and somewhat unexpected of
these were students’ responses to items 16 and 17, which asked
students what they considered the “best thing about having
the materials for this course on the Web” and the “main
reason why they accessed the course Web site.” These
data are shown in Table 2.
Table 2. Student Responses to Free Response Survey Questions 16 and 17
|
Given the popularity of the Grade Display Program and the
increased number of “hits” that it generated, the
professor expected this feature to be mentioned most often.
He was pleasantly surprised to see that students actually
valued more highly having the lecture notes available. Not
only did students mention the lecture notes more often as the
best thing about the Web site, but they also claimed to access
the Web site more often to see the lecture notes than to use the
Grade Display Program.
The third way the survey asked students to evaluate the course
Web site was to have them rank the major site components in order
of their value. This was question 19 in the survey, in
which students ranked eight components in order of their value,
with 1 indicating the most valuable and 8 the least. Data
on student responses to this question are presented in Table 3.
Table 3. Student Rankings of the Value of Web Site Components in Mode Order
Rank |
Component |
Mean |
Median |
Mode |
| 1 | Lecture notes | 1.9 | 1 | 1 |
| 2 | Grade display program | 3.1 | 3 | 2 |
| 3 | Assignments | 2.6 | 3 | 3 |
| 4 | Course syllabus and calendar | 4.0 | 4 | 5 |
| 5 | File downloads | 4.6 | 5 | 5 |
| 6 | Industry news items | 6.2 | 6 | 6 |
| 7 | Anonymous suggestion box | 6.6 | 7 | 8 |
8 |
Links to external sites |
6.7 |
7 |
8 |
These data corroborate those presented in the previous two
sections: that students valued most having the course lecture
notes on-line, followed by the availability of the Grade Display
Program and the assignments (note that ranks were determined by
the mode, not the mean).
As in other studies, one must recognize that the fact that students react favorably to a course Web site is not evidence that they actually learn better because of it. It is virtually impossible to prove conclusively that students learn better as a result of any application of technology due to the large number of uncontrollable variables in such studies, not to mention the numerous extraneous conditions that influence results such as the Hawthorne Effect (Roethlisberger and Dickson, 1939, [9] as referenced by Biehler, 1971, [1]) and Experimenter Bias Effect (Rosenthal, 1966, [10], as referenced by Biehler, 1971, [1]).
Note: Biehler (1971) explains these effects as follows. “The Hawthorne Effect, which was given that label because it was first recognized in a study made at the Hawthorne, Illinois, plant of Western Electric Company, is the tendency of subjects in some experiments to respond the almost any kind of change, apparently due to a feeling of appreciation that someone is paying attention to them. The experimenter bias effect ... is the subtle and unintentional transmission of an expectancy of the experimenter to the subjects of a study.” (p. 48)
For example, the fact that most UMass Lowell professors do not have extensive course Web sites with their lecture notes on-line made the situation under study a novelty for students and that may have motivated them to put a little more effort into the course. When such Web sites are the norm, that effect will have worn off. This situation could create a type of Hawthorne Effect. In addition, the professor had a great deal of personal interest in developing the course Web site and got a great deal of personal satisfaction out of doing so, which made him enthusiastic the Web site, and he often referred to it in class and encouraged students to see material posted there. Such enthusiasm is often contagious and can enhance students’ involvement in a course and their consequent performance in that course and therefore could create a type of Experimenter Bias Effect.
In addition to these types of effects, it is difficult in today’s academic environment to give two sets of students different versions of a course and compare their results in a tightly controlled manner. One can get approval to conduct small studies on single lessons unrelated to core curricula, but campus ethics and students’ rights groups are loathe to approving studies in real core subjects in which one class is taught in a manner that most believe will enhance their learning while another is deprived the benefit of that approach so that they can serve as a control group. It is even more difficult to get approval to compare one professor’s class against that of another professor, for fear that such analysis will reveal the teaching deficiencies of one professor or the other.
Thus, one has to look for situations that already exist that
one can use to compare performance. Such situations will
virtually always be flawed from a purely statistical point of
view, but if one interprets results in a limited scope as Ehrman
(1995, op cit) suggests, much can be learned about
improving teaching and learning in a local environment.
Fortunately, such a pre-existing situation did exist at UMass
Lowell when the current study was undertaken. That
situation was carefully analyzed to yield the results presented
in the next section.
Beginning in 1994, the same computer science professor had
taught the same course, 91.353 GUI Programming I, during four
successive fall semesters (Lewy, 1996, [7]).
The course was taught without a course Web site in 1994 and 1995,
and with a course Web site in 1996 and 1997. Except for the
addition of the course Web site and the updating of some of the
technical material, the course was essentially the same in each
of the four semesters. A box-and-whisker quartile chart
showing the distribution of final student grades in each of the
four years is shown in Figure 10.
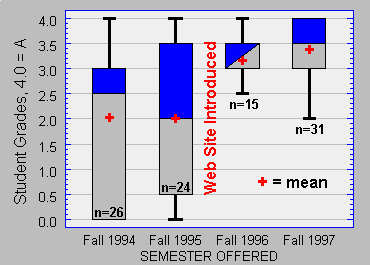
Analysis of variance results on the
data in Figure 10 are presented in Table 4, and analyses of their
ranges are shown in Table 5. (Data analysis was performed
using Statlets, a
statistical package available from NWP Associates, Inc. of
Princeton, NJ, and provided free of charge to academic
institutions.) These tables confirm what the professor had
hoped: that there was a statistically significant difference in
student performance after the Web site was introduced into the
course.
Table 4. ANOVA Results of Final Student Grade Data Presented in Figure 10.
|
Sum
of |
Degrees
of |
Mean |
F |
P |
| Between groups | 40.70 | 3 | 13.56 | 10.26 | 1.0E-4 |
| Within groups | 121.65 | 92 | 1.32 | ||
Total |
162.35 |
95 |
|
|
|
Statlets Interpretation: Since the P-value of the F-test is less than 0.05, there is a statistically significant difference between the means of the various groups at the 5.0% significance level.
Table 5. Analysis of Ranges of Final Student Grade Data Presented in Figure 10.
Contrast |
Difference |
+/- Limits |
Significant |
| Fall 1994 - Fall 1995 | 0.038 | 0.646 | |
| Fall 1994 - Fall 1996 | -1.128 | 0.740 | * |
| Fall 1994 - Fall 1997 | -1.348 | 0.607 | * |
| Fall 1995 - Fall 1996 | -1.166 | 0.751 | * |
| Fall 1995 - Fall 1997 | -1.387 | 0.620 | * |
Fall 1996 - Fall 1997 |
-0.220 |
0.718 |
|
Statlets Interpretation: * = statistically significant difference at the 5.0% significance level using Fisher’s least significant difference procedure.
On April 16, 1997, the author had the opportunity to discuss this research with Dr. Ben Shneiderman, the University of Maryland’s renowned Human Factors researcher. While lending his insights to the topic and his advice on data analysis, Shneiderman suggested that the author research analytical techniques for focusing on the performance of the lower half of the class, that is, the poorer students. Shneiderman’s reasoning was that “good students will learn regardless of the instructional techniques employed. Poor students, however, may show marked differences in performance when something like a course Web site is made available as an enhancement to traditional classroom instruction.” (paraphrased by JMH, [11]).
Given this direction, the author enlisted the help of Dr. Shelley Rasmussen, Associate Professor of Mathematics at the University of Massachusetts Lowell, to devise such an analysis. Rasmussen (1992, [8]) suggested computing an estimated “probability of success,” defined as the ratio of the number of “successful” students to the total number of students. Assuming random sampling, the standard deviation of this ratio could be approximated by its standard error. Thus, if the estimated probability of success is
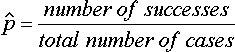
then the standard error
of ![]() is
is
A traditional
rule-of-thumb cautions that these formulae are “reasonable
to use if the numbers of observed successes and failures is at
least five.” The problem, then, is to define what
constitutes “success.” Unfortunately, there was
no single final letter grade at which the data could be cut so
that at least five students fell into the “success” and “failure” categories in all four years. Setting
the success criterion as “BC or Better” resulted in
only 1 student in the “C or Worse” category for
1997. Setting the criterion as “B or better” resulted in only 3 students in the
“BC or Worse” category for 1997. And setting the criterion as “AB or
Better” resulted in only 3 students in the “AB or
Worse” category for 1994. Thus, statistical
significance on this measure cannot be established on this
dimension for the data used in this study. Nonetheless,
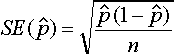
Figure 11 shows these data presented using a success criterion of “B or Better” to provide a feel for the type of
analysis that Shneiderman suggested, and one that would be
reasonable to use on larger samples.
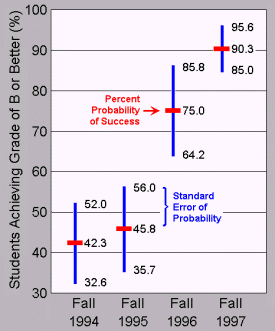
Figure 11. Probability of B or Better Grade Success (same course over four years)
Evaluation of a course Web site is clearly an inexact science, but it can be seen that analysis is possible within limited parameters and when the scope of interpretation of results is well-defined. Work such as that by Trochim (1996, op cit) may shed light on which analysis techniques are better than others for specific purposes, but it will remain difficult to control all variables that can influence student performance, particularly in university core courses.
Nonetheless, the author is encouraged not only by his students’ positive feedback on the value of course Web sites, but also by the positive effects on their performance indicated by the results of statistical analysis. While one cannot generalize these results to all courses taught by all professors, one can surely state that contrary to the conclusion drawn by Jordan (1997, op cit), creation and maintenance of the course Web site is indeed worth the extra time and effort that it entails.
Analyses on data from additional courses taught by the professor will be conducted in the coming months. In addition, historical data on student performance is available for UMass Lowell course 91.101, Computing I, which has been taken by over 200 students per semester over the last few years and has historically high failure and drop-out rates. This course will be enhanced by the availability of a course Web site for the first time in the fall 1998 semester, and it will be interesting to see if any dent can be made in these rates so that student retention, if not performance, is improved.
| [1] | Biehler,
Robert F., 1971. Psychology Applied to Teaching.
Houghton-Mifflin Company, Boston, p. 48. |
|
[2] |
Ehrmann,
Stephen C., 1995. Asking the Right Questions:
What Does Research Tell Us About Technology and Higher
Learning? Change 27(2):20-27, March/April
1995. |
|
| [3] | Fitzelle,
George T., Jr. and William M. K. Trochim, 1996. Survey
Evaluation of Web Site Instructional Technology: Does It
Increase Student Learning? Annual Conference
of the American Evaluation Association, Atlanta, GA,
November 1996. Paper posted at URL http://trochim.human.cornell.edu/webeval/webques/webques.htm. |
|
| [4] | Gilbert,
Steven W., 1998. Lazy Students &
Faculty? Posting to the Teaching, Learning, and
Technology list processor of the American Association for
Higher Education (aahesgit@list.cren.net)
dated February 5, 1998, message number AAHESGIT 2. |
|
| [5] | Jordan, David,
1997. Evaluation of a Web Site as a Teaching Tool in
MMW-1 (Track C), Autumn, 1997. Paper originally
posted at URL
http://www.ucsd.edu/~dkjordan/mmw/mmweval/mooeval97.html
(no longer available, last checked on May 14, 2002). |
|
| [6] | Kulik, Chen-Lin
C., and James A. Kulick, 1991. Effectiveness
of Computer-Based Instruction: An Updated Analysis.
Computers in Human Behavior 7(1-2):75-94. |
|
| [7] | Lewy, Deborah,
1996. At the University of Massachusetts
Lowell, Students Use Visual Basic and Visual C++-and Get
an In-Depth Understanding of Microsoft Windows. Article
previously posted on the Microsoft Academic Cooperative
Web Site, now available at http://www.cs.uml.edu/~heines/academic/success9.html.
|
|
| [8] | Rasmussen,
Shelley, 1992. An Introduction to Statistics
with Data Analysis. Brooks/Cole Publishing
Company, Pacific Grove, CA. Also personal
conversations, Spring 1998. |
|
| [9] | Roethlisberger,
F. J., and W. J. Dickson, 1939. Management and
the Worker. Harvard University Press,
Cambridge, MA. [Secondary reference quoted by
Biehler, 1971.] |
|
| [10] | Rosenthal,
Robert, 1966. Experimenter Bias Effects in
Behavioral Research. Appleton-Century-Crofts,
New York. [Secondary reference quoted by Biehler,
1971.] |
|
| [11] | Shneiderman,
Ben, 1997. Personal conversation.
October 16, 1997. See http://www.cs.umd.edu/~ben/
for information on Shneiderman’s work. |
|
| [12] | Trochim,
William, 1996. Evaluating Websites:
Introduction. Annual Conference of the
American Evaluation Association, Atlanta, GA, November
1996. Paper posted at URL http://trochim.human.cornell.edu/webeval/intro.htm. |
|
| [13] | Williams Glaser, Candyce, 1998. Creating New Standards for Higher Education: Effecting Pedagogical Change in the Undergraduate Curriculum through the Integration of Technology. Unpublished Doctoral Dissertation, Peabody College (of education and human development), Vanderbilt University. Quote from a posting to the Teaching, Learning, and Technology list processor of the American Association for Higher Education (aahesgit@list.cren.net) dated February 25, 1998, message number AAHESGIT 20. |
The author wishes to acknowledge the assistance of his student workers in the CBT Development Lab who tabulated the survey and grade data presented in this paper. In addition, student Shyam Sarda provided invaluable assistance with the literature search.
Shelley Rasmussen, Associate Professor, UMass Lowell Dept. of Mathematics, provided critical assistance and advice on analyzing, interpreting, and displaying the data presented in this study. Brian O’Neill, Director of Computing, UMass Lowell Dept. of Computer Science, provided assistance and advice in many phases of the Web site implementation.
The graphs included in this paper were enhanced from ones generated by Statlets, a statistical package available from NWP Associates, Inc., of Princeton, NJ, and provided free of charge to academic institutions. The Microsoft software used in this student was supplied in part by a grant from the Microsoft Academic Cooperative.
91.201 and 91.353
Course Web Sites
Usage Survey
Fall Semester, 1997
This survey is intended to gather data about your use of Dr. Heines’ Web site for 91.201 and 91.353. Please take your time and answer the questions carefully. We need honest answers to get an accurate picture of how to improve the Web site for future classes.
If you answer the questions on paper, please feel free to use all the space you need. You do not have to squeeze your answers into the text boxes.
Thank you for your time.